|
Sino Biological
monoclonal antibody targeting mouse ldlr Monoclonal Antibody Targeting Mouse Ldlr, supplied by Sino Biological, used in various techniques. Bioz Stars score: 92/100, based on 1 PubMed citations. ZERO BIAS - scores, article reviews, protocol conditions and more https://www.bioz.com/product/mouse+ldlr+antibody/LDLR+%2F+LDL+R+%2F+LDL+Receptor+Antibody%2C+Mouse+MAb/pmc11302870-26-1-9 Average 92 stars, based on 1 article reviews
monoclonal antibody targeting mouse ldlr - by Bioz Stars,
2026-10
92/100 stars
|
Buy from Supplier |
|
Bio-Techne corporation
mouse ldlr biotinylated antibody Mouse Ldlr Biotinylated Antibody, supplied by Bio-Techne corporation, used in various techniques. Bioz Stars score: 90/100, based on 1 PubMed citations. ZERO BIAS - scores, article reviews, protocol conditions and more https://www.bioz.com/product/mouse+ldlr+antibody/Mouse+LDLR+Biotinylated+Antibody/bio-techne+corporation___baf2255 Average 90 stars, based on 1 article reviews
mouse ldlr biotinylated antibody - by Bioz Stars,
2026-10
90/100 stars
|
Buy from Supplier |
|
R&D Systems
ldl receptor  Ldl Receptor, supplied by R&D Systems, used in various techniques. Bioz Stars score: 93/100, based on 1 PubMed citations. ZERO BIAS - scores, article reviews, protocol conditions and more https://www.bioz.com/product/mouse+ldlr+antibody/Mouse+LDLR+Antibody/10__1161_slash_atvbaha__111__235721-387-8-11 Average 93 stars, based on 1 article reviews
ldl receptor - by Bioz Stars,
2026-10
93/100 stars
|
Buy from Supplier |
|
R&D Systems
mouse ldlr pe conjugated antibody  Mouse Ldlr Pe Conjugated Antibody, supplied by R&D Systems, used in various techniques. Bioz Stars score: 94/100, based on 1 PubMed citations. ZERO BIAS - scores, article reviews, protocol conditions and more https://www.bioz.com/product/mouse+ldlr+antibody/Mouse+LDLR+PE-conjugated+Antibody/pmc12491593-247-18-22 Average 94 stars, based on 1 article reviews
mouse ldlr pe conjugated antibody - by Bioz Stars,
2026-10
94/100 stars
|
Buy from Supplier |
|
R&D Systems
mouse ldlr antibody  Mouse Ldlr Antibody, supplied by R&D Systems, used in various techniques. Bioz Stars score: 93/100, based on 1 PubMed citations. ZERO BIAS - scores, article reviews, protocol conditions and more https://www.bioz.com/product/mouse+ldlr+antibody/Mouse+LDLR+Antibody/pmc04513119-347-11-15 Average 93 stars, based on 1 article reviews
mouse ldlr antibody - by Bioz Stars,
2026-10
93/100 stars
|
Buy from Supplier |
|
R&D Systems
primary antibodies against ldlr  Primary Antibodies Against Ldlr, supplied by R&D Systems, used in various techniques. Bioz Stars score: 94/100, based on 1 PubMed citations. ZERO BIAS - scores, article reviews, protocol conditions and more https://www.bioz.com/product/mouse+ldlr+antibody/Mouse+LDLR+Antibody/bio_rxiv__2024__02__23__581685-224-0-4 Average 94 stars, based on 1 article reviews
primary antibodies against ldlr - by Bioz Stars,
2026-10
94/100 stars
|
Buy from Supplier |
|
R&D Systems
monoclonal mouse ldlr antibody  Monoclonal Mouse Ldlr Antibody, supplied by R&D Systems, used in various techniques. Bioz Stars score: 91/100, based on 1 PubMed citations. ZERO BIAS - scores, article reviews, protocol conditions and more https://www.bioz.com/product/mouse+ldlr+antibody/Mouse+LDLR+Antibody/pmc03111744-121-15-20 Average 91 stars, based on 1 article reviews
monoclonal mouse ldlr antibody - by Bioz Stars,
2026-10
91/100 stars
|
Buy from Supplier |
|
Sino Biological
mouse anti ldlr ab Mouse Anti Ldlr Ab, supplied by Sino Biological, used in various techniques. Bioz Stars score: 92/100, based on 1 PubMed citations. ZERO BIAS - scores, article reviews, protocol conditions and more https://www.bioz.com/product/mouse+ldlr+antibody/LDLR+%2F+LDL+Receptor+Antibody%2C+Mouse+MAb/pm38961200-263-12-17 Average 92 stars, based on 1 article reviews
mouse anti ldlr ab - by Bioz Stars,
2026-10
92/100 stars
|
Buy from Supplier |
|
R&D Systems
goat polyclonal anti ldlr Goat Polyclonal Anti Ldlr, supplied by R&D Systems, used in various techniques. Bioz Stars score: 90/100, based on 1 PubMed citations. ZERO BIAS - scores, article reviews, protocol conditions and more https://www.bioz.com/product/mouse+ldlr+antibody/Mouse+LDLR+Biotinylated+Antibody/pmc03958050-75-44-47 Average 90 stars, based on 1 article reviews
goat polyclonal anti ldlr - by Bioz Stars,
2026-10
90/100 stars
|
Buy from Supplier |
|
Bio-Techne corporation
mouse ldlr pe-conjugated antibody Mouse Ldlr Pe Conjugated Antibody, supplied by Bio-Techne corporation, used in various techniques. Bioz Stars score: 94/100, based on 1 PubMed citations. ZERO BIAS - scores, article reviews, protocol conditions and more https://www.bioz.com/product/mouse+ldlr+antibody/Mouse+LDLR+PE-conjugated+Antibody/bio-techne+corporation___fab2255p Average 94 stars, based on 1 article reviews
mouse ldlr pe-conjugated antibody - by Bioz Stars,
2026-10
94/100 stars
|
Buy from Supplier |
|
LDLR mouse monoclonal antibody clone OTI8D12 HRP conjugated
|
Buy from Supplier |
|
The Mouse LDLR Alexa Fluor® 700-conjugated Antibody from R&D Systems is a LDLR antibody to LDLR. This antibody reacts with Mouse. The LDLR antibody has been validated for the following applications: Flow Cytometry.
|
Buy from Supplier |
Image Search Results
Journal: Arteriosclerosis, Thrombosis, and Vascular Biology
Article Title: CCL20 Is Increased in Hypercholesterolemic Subjects and Is Upregulated By LDL in Vascular Smooth Muscle Cells
doi: 10.1161/atvbaha.111.235721
Figure Lengend Snippet: Figure 3. LDL induce CCL20 expression through a transcriptional mechanism that involves NF-B. A, Vascular smooth muscle cells (VSMC) were induced with 300 g/mL LDL for 4 hours in the presence or in the absence of 5,6-dicloro-1-(b-D-ribofuranosil)- benzimidazol (DRB) and CCL20 expression was analyzed (n9; P0.05: *vs control cells; #vs cells treated with LDL alone). B, VSMC were transfected with the pCCL20/-2007 construct and treated with LDL (300 g/mL for 7 hours) (n9; P0.05: *vs control cells). C, Effect of NDGA, parthenolide (Part) and BAY 11-7082 (BAY) on CCL20 mRNA levels induced by LDL (300 g/mL for 4 hours) (n9; P0.05: *vs controls; #vs LDL alone). D, VSMC were treated with LDL (300 g/mL) in the presence or absence of parthenolide, and cytosolic or nuclear extracts were analyzed by Western blot. Representative immunoblots using antibodies against IB and p65 are shown. Beta-actin and nucleolin (Nucl.) were used as a loading control for citosolic and nuclear extracts, respectively. E, Confocal microscopy analysis showing the mobilization of p65 to the nuclei in cells stimulated with LDL and the preventive effect exerted by par- thenolide (LDL/Part).
Article Snippet: In some experiments, blocking antibodies (10 g/mL) to
Techniques: Expressing, Control, Transfection, Construct, Western Blot, Confocal Microscopy

Journal: Arteriosclerosis, Thrombosis, and Vascular Biology
Article Title: CCL20 Is Increased in Hypercholesterolemic Subjects and Is Upregulated By LDL in Vascular Smooth Muscle Cells
doi: 10.1161/atvbaha.111.235721
Figure Lengend Snippet: Figure 4. NF-B is involved in LDL-induced CCL20 upregulation. A, Vascular smooth muscle cells (VSMC) were transiently transfected with various CCL20 promoter deletion mutants and promoter activity in the absence (white bars) or presence of LDL (black bars; 300 g/mL for 7 hours) was assessed. The location of the putative response elements is indicated. The activity of pCCL20/-117 mutated in the NF-B site (80/71; deleted white circle) is also shown (n7; P0.05: *vs control cells transfected with the same construct). B, Schematic representation of pCCL20/-165. The core consensus of the NF-B site is indicated in bold, and changes introduced by mutagenesis are boxed. C, Representative autoradiogram of EMSA performed with the CCL20-88/-65 probe and nuclear protein extracts from controls and cells treated with LDL in the presence or absence of 1 mol/L parthenolide (Part). The position of 4 com- plexes (I to IV), whose upregulation by LDL was prevented by parthenolide (left panel) and competed by a molar excess of unlabeled probe (100-fold) (middle panel) is indicated. The supershifted bands on addition of a specific antibody against p65 (antip65) are indi- cated (right panel; double arrowhead). D, Chromatin immunoprecipitation (ChIP) from control cells and cells treated with LDL (300 g/mL for 2 hours) using an antip65 antibody (IP: p65) or a nonspecific rabbit IgG (IP: IgG). Top: The enrichment of NFB was quanti- fied by real-time PCR using CCL20 promoter specific primers. Data were normalized to the total input DNA and are represented as meansSEM of 2 independent experiments performed in duplicate (P0.05: *vs controls). Bottom: Agarose gel electrophoresis of PCR products.
Article Snippet: In some experiments, blocking antibodies (10 g/mL) to
Techniques: Transfection, Activity Assay, Control, Construct, Mutagenesis, Chromatin Immunoprecipitation, Real-time Polymerase Chain Reaction, Agarose Gel Electrophoresis
Journal: Communications Biology
Article Title: ABCC4 impairs the clearance of plasma LDL cholesterol through suppressing LDLR expression in the liver
doi: 10.1038/s42003-025-08818-x
Figure Lengend Snippet: a Schematic workflow of genome-scale CRISPR screening process. b , c MAGeCK gene enrichment scores comparing LDLR high subpopulation and unsorted cells from two independent screens (M1 and M2). d Venn diagram showing genes identified in two independent biological replicates (M1 and M2).
Article Snippet: Flow cytometry gating for LDLR expression was defined relative to IgG Isotype control or LDLR-targeted wide-type cells, using
Techniques: CRISPR

Journal: Communications Biology
Article Title: ABCC4 impairs the clearance of plasma LDL cholesterol through suppressing LDLR expression in the liver
doi: 10.1038/s42003-025-08818-x
Figure Lengend Snippet: a, b CRISPR/Cas9–mediated knockout of Abcc4 in AML12 cells ( a ) and LO2 cells ( b ) using two independent sgRNAs. Immunoblotting analysis of ABCC4 protein expression and Vinculin in control-KO cells and Abcc4 -KO cells (Rosa26 sgRNA, Abcc4 sgRNA #1, Abcc4 sgRNA #2). b Immunoblotting experiments of ABCC4 and Vinculin in control-KO cells and ABCC4-KO cells (AAVS1 sgRNA, ABCC4 sgRNA #1, #2). c Flow cytometry data showing that knockout of Abcc4 increased the abundance of LDLR on the AML12 cell surface (Representative data from n = 3 independent experiments with similar results). d Plot showing the relative Mean Fluorescence Intensity (MFI) of PE-LDLR from three independent experiments. e Immunoblotting analysis of plasma membrane fractions demonstrating that Abcc4 knockout dramatically increased the amount of LDLR on PM. f Quantification of band intensity of LDLR protein expression relative to Na/K-ATPase from three independent experiments. g Cultured AML12 cells were precooled to 4°C for 30 min and incubated with Dil-LDL for binding at 4°C. Then the cells were washed 3 times with ice-chilled PBS. The cells were substantially switched to 37 °C for uptake. h Representative immunofluorescence microscopy images showing that Abcc4 knockout in AML12 cells had potentiated influence on DiI-LDL binding (0 h) and uptake (1 h). Blue: DAPI; Red: Dil-LDL. Scale bar: 50 μm. i Dil-LDL uptake assay implying that LDL uptake was significantly promoted in Abcc4 -deficient cells by flow cytometry analysis (Representative data from n = 3 independent experiments with similar results). j The relative MFI of Dil-LDL quantification were from 3 independent experiments. k FC data showing that knockout of ABCC4 promotes the cell surface LDLR accessibility in LO2 cells (Representative data from n = 3 independent experiments with similar results). l The relative MFI of LDLR-PE quantification was from three independent experiments. m Immunoblotting analysis of LDLR quantification located on the plasma membrane fractions relative to Na/K-ATPase in LO2 cells. n Flow cytometry analysis showing that LDL uptake by LDLR was significantly promoted in LO2 cells lacking ABCC4 (Representative data from n = 3 independent experiments with similar results). o The relative MFI of Dil-LDL quantification were from three independent experiments. Statistical analysis was performed by a ordinary one-way ANOVA followed by Bonferroni’s multiple comparison test in ( d ), ( f ), ( j ), ( l ), ( o ). * P ≤ 0.05, ** P ≤ 0.01, *** P ≤ 0.001, **** P ≤ 0.0001, ns: no significance. Data are the mean ± SEM. Source data are provided as a Source Data file.
Article Snippet: Flow cytometry gating for LDLR expression was defined relative to IgG Isotype control or LDLR-targeted wide-type cells, using
Techniques: CRISPR, Knock-Out, Western Blot, Expressing, Control, Flow Cytometry, Fluorescence, Clinical Proteomics, Membrane, Cell Culture, Incubation, Binding Assay, Immunofluorescence, Microscopy, Comparison

Journal: Communications Biology
Article Title: ABCC4 impairs the clearance of plasma LDL cholesterol through suppressing LDLR expression in the liver
doi: 10.1038/s42003-025-08818-x
Figure Lengend Snippet: a WT C57BL/6 male mice were treated with control AAV_GFP_RNAi or AAV_Abcc4_RNAi by tail vein injection (2×10 11 viral genomes per mouse, n = 6 per group) for 3 weeks. b Hepatic Abcc4 mRNA expression level in WT mice between two groups. c Representative immunoblotting data of hepatic ABCC4 protein expression level in WT mice between two groups. d Quantification of band intensity of ABCC4 protein level relative to Vinculin in liver tissue from two groups. e Representative immunoblotting data of membrane LDLR protein expression from liver tissue membrane fractions in mice. f Quantification of band intensity of membrane LDLR protein level relative to Na/K-ATPase in liver tissue from two groups. g Serum LDL-C level in WT mice between two groups. h Serum TC level in in WT mice between two groups. i Serum TG level in WT mice between two groups. Statistical analysis was performed by an unpaired two-tailed Student’s t-test in ( b ), ( d ), ( f ), ( g ), ( h ), ( i ). ** P ≤ 0.01, *** P ≤ 0.001, ns: no significance. Data are the mean ± SEM. Source data are provided as a Source Data file.
Article Snippet: Flow cytometry gating for LDLR expression was defined relative to IgG Isotype control or LDLR-targeted wide-type cells, using
Techniques: Control, Injection, Expressing, Western Blot, Membrane, Two Tailed Test

Journal: Communications Biology
Article Title: ABCC4 impairs the clearance of plasma LDL cholesterol through suppressing LDLR expression in the liver
doi: 10.1038/s42003-025-08818-x
Figure Lengend Snippet: a Flow cytometry data showing that ABCC4 inhibitor treatment potentiates surface LDLR availability (Representative data from n = 5 independent experiments with similar results). b Plot showing the relative Mean Fluorescence Intensity (MFI) of PE-LDLR from five independent experiments. c Immunoblotting experiments of the plasma membrane fractions demonstrating that ABCC4 inhibitor treatment up-regulates surface LDLR protein expression in AML12 cells. d Quantification of band intensity of surface LDLR protein expression relative to Na/K-ATPase in AML12 cells (Data from n = 3 independent experiments). e Wild-type male mice ( n = 6 per group) were injected intraperitoneally three times a week with a dose of Ceefourin-1 (10 mg/kg) or vehicle control (DMSO and corn oil) for 4 weeks under normal-chow diet (NCD) or high-fat diet (HFD) conditions. f Plot displaying changes of body weight in mice intraperitoneally with vehicle control and ABCC4 inhibitor Ceefourin-1 under a NCD or HFD condition. g Serum LDL-C level in WT mice treated as in ( e ). h Serum TC level in WT mice treated as in ( e ). i Serum TG level in WT mice treated as in ( e ). j Liver TC level in WT mice treated as in ( e ). k Liver TG level in WT mice treated as in ( e ). l Hematoxylin and eosin (H&E) and Oil Red O staining analysis revealing that ABCC4 inhibitor treatment improved lipid accumulation, especially under a HFD condition. Scale bar: 50 μm. m Immunoblotting data of LDLR protein expression from liver plasma membrane fractions in NDC-fed mice treated with Ceefourin-1 or vehicle. n Representative immunoblotting data of LDLR expression from liver plasma membrane fractions in HFD-fed mice treated with Ceefourin-1 or vehicle. o Quantification of band intensity of LDLR protein level relative to Na/K-ATPase in liver plasma membrane fractions from the mice treated as in ( e ). Statistical analysis was performed by an unpaired two-tailed Student’s t-test in ( b ), ( d ); a ordinary one-way ANOVA followed by Bonferroni’s multiple comparison test in ( g ), ( h ), ( i ), ( j ), ( k ), ( o ). * P ≤ 0.5, ** P ≤ 0.01, *** P ≤ 0.001, **** P ≤ 0.0001, ns: no significance. Data are the mean ± SEM. Source data are provided as a Source Data file.
Article Snippet: Flow cytometry gating for LDLR expression was defined relative to IgG Isotype control or LDLR-targeted wide-type cells, using
Techniques: Flow Cytometry, Fluorescence, Western Blot, Clinical Proteomics, Membrane, Expressing, Injection, Control, Staining, Two Tailed Test, Comparison

Journal: Communications Biology
Article Title: ABCC4 impairs the clearance of plasma LDL cholesterol through suppressing LDLR expression in the liver
doi: 10.1038/s42003-025-08818-x
Figure Lengend Snippet: a Principal component analysis showing distinct clustering of transcriptomes of the samples between Abcc4 -knockout (Abcc4 sgRNA) and control-knockout (Rosa26 sgRNA) AML12 cells. b Hierarchically clustered circos heatmap of top 43 differentially expressed genes (DEGs) between two groups ( P < 0.05; fold change>2.0). c KEGG pathway enrichment analysis of DEGs. d , e GSEA showing activated cAMP ( d ) and Rap1 ( e ) signaling pathways for DEGs between two groups. f Heatmap showing the enriched pathways related to lipid metabolism process, insulin secretion signaling, cAMP signaling, cGMP-PKG signaling, and Rap1 signaling for DEGs. g ELISA measurements showing increased intracellular and reduced extracellular cAMP levels in Abcc4 -deficient cells. h ELISA measurements showing increased intracellular and reduced extracellular cAMP levels in AML 12 cell treated with the ABCC4 inhibitor Ceefourin-1. i Immunoblotting experiments showing PCSK9 protein levels in Abcc4 -deficient cells. j Quantification of band intensity of PCSK9 protein expression relative to Vinculin in Abcc4 -deficient cells from three independent experiments. k Secreted PCSK9 levels in Abcc4 -deficient cells. l RT-qPCR results assessing Pcsk9 mRNA level in Abcc4 -deficient cells from three independent experiments. m Immunoblotting experiments showing PCSK9 protein level in AML12 cell treated with DMSO or Ceefourin-1. n Quantification of band intensity of PCSK9 protein level relative to Vinculin between two groups from three independent experiments. o Secreted PCSK9 levels in AML12 cells treated with DMSO or Ceefourin-1. p Pcsk9 relative mRNA expression level by RT-qPCR between two groups from three independent experiments. q Immunoblotting analysis of PCSK9 protein levels in Abcc4 -deficient cells treated with cycloheximide (cyclo: 4 μg/mL) for 30 min (+) and 90 min (++). r Flow cytometry analysis of Dil-LDL uptake assay (1 h) in Abcc4 -deficient cells treated with Vehicle or rhPCSK9 protein. The relative MFI of Dil-LDL quantification were from three independent experiments. s Immunoblotting analysis of LDLR expression from the plasma membrane fractions in Abcc4 -deficient cells. Statistical analysis was performed by a Welch ANOVA test followed by a post hoc analysis using the Tamhane T2 method in ( g ); an unpaired two-tailed Student’s t-test in ( h ), ( n ), ( o ), ( p ); a ordinary one-way ANOVA followed by Bonferroni’s multiple comparison test in ( j ), ( k ), ( l ), ( r ). * P ≤ 0.5, ** P ≤ 0.01, *** P ≤ 0.001, **** P ≤ 0.0001, ns: no significance. Data are the mean ± SEM. Source data are provided as a Source Data file.
Article Snippet: Flow cytometry gating for LDLR expression was defined relative to IgG Isotype control or LDLR-targeted wide-type cells, using
Techniques: Knock-Out, Control, Protein-Protein interactions, Enzyme-linked Immunosorbent Assay, Western Blot, Expressing, Quantitative RT-PCR, Flow Cytometry, Clinical Proteomics, Membrane, Two Tailed Test, Comparison

Journal: Communications Biology
Article Title: ABCC4 impairs the clearance of plasma LDL cholesterol through suppressing LDLR expression in the liver
doi: 10.1038/s42003-025-08818-x
Figure Lengend Snippet: a Generation of Abcc4/Epac2 double-knockout (DKO) AML12 cells using two sgRNAs targeting Epac2 gene. Immunoblotting analysis of ABCC4, EPAC2 and Vinculin protein expression in AML12 cells (Rosa26 sgRNA, Abcc4 sgRNA #1, Abcc4 sgRNA #2, Abcc4/Epac2 sgRNA #1, Abcc4/Epac2 gRNA #2). b Immunoblotting analysis of LDLR protein expression from the plasma membrane fractions in AML12 cells (Rosa26 sgRNA, Abcc4 sgRNA #1, Abcc4 sgRNA #2, Abcc4/Epac2 sgRNA #1, Abcc4/Epac2 gRNA #2). c Flow cytometry analysis of Dil-LDL uptake assay (1 h) in AML12 cells (Rosa26 sgRNA, Abcc4 sgRNA, Abcc4/Epac2 sgRNA). d The relative MFI of Dil-LDL quantification were from 3 independent experiments. e Immunoblotting analysis of PCSK9 protein expression in AML12 cells (Rosa26 sgRNA, Abcc4 sgRNA #1, Abcc4 sgRNA #2, Abcc4/Epac2 sgRNA #1, Abcc4/Epac2 gRNA #2). f Secreted PCSK9 levels in AML12 cells (Rosa26 sgRNA, Abcc4 sgRNA, Abcc4/Epac2 sgRNA) from four independent experiments. g Relative Pcsk9 mRNA expression level in AML12 cells (Rosa26 sgRNA, Abcc4 sgRNA, Abcc4/Epac2 sgRNA) from four independent experiments. h Generation of Abcc4/Rap1a DKO AML12 cells using two independent sgRNAs targeting Rap1a gene. Immunoblotting analysis of ABCC4, RAP1A and Vinculin protein expression in AML12 cells (Rosa26 sgRNA, Abcc4 sgRNA #1, Abcc4 sgRNA #2, Abcc4/Rap1a sgRNA #1, Abcc4/Rap1a sgRNA #2). i Immunoblotting analysis of LDLR protein expression from the plasma membrane fractions in AML12 cells (Rosa26 sgRNA, Abcc4 sgRNA #1, Abcc4 sgRNA #2, Abcc4/Rap1a sgRNA #1, Abcc4/Rap1a sgRNA #2). j Flow cytometry analysis of Dil-LDL uptake assay (1 h) in AML12 cells (Rosa26 sgRNA, Abcc4 sgRNA, Abcc4/Rap1a sgRNA). k The relative MFI of Dil-LDL quantification were from 3 independent experiments. l Immunoblotting analysis of PCSK9 protein expression in AML12 cells (Rosa26 sgRNA, Abcc4 sgRNA #1, Abcc4 sgRNA #2, Abcc4/Rap1a sgRNA #1, Abcc4/Rap1a sgRNA #2). m Secreted PCSK9 levels in AML12 cells (Rosa26 sgRNA, Abcc4 sgRNA, Abcc4/Rap1a sgRNA) from four independent experiments . n Relative Pcsk9 mRNA expression level in AML12 cells (Rosa26 sgRNA, Abcc4 sgRNA, Abcc4/Rap1a sgRNA) from four independent experiments. Statistical analysis was performed by a Welch ANOVA test followed by a post hoc analysis using the Tamhane T2 method in ( d ), ( k ); a ordinary one-way ANOVA followed by Bonferroni’s multiple comparison test in ( f ), ( g ), ( m ), ( n ). * P ≤ 0.5, ** P ≤ 0.01, *** P ≤ 0.001, **** P ≤ 0.0001, ns: no significance. Data are the mean ± SEM. Source data are provided as a Source Data file.
Article Snippet: Flow cytometry gating for LDLR expression was defined relative to IgG Isotype control or LDLR-targeted wide-type cells, using
Techniques: Double Knockout, Western Blot, Expressing, Clinical Proteomics, Membrane, Flow Cytometry, Comparison
Journal: The Journal of Biological Chemistry
Article Title: Amyloid Precursor-like Protein 2 and Sortilin Do Not Regulate the PCSK9 Convertase-mediated Low Density Lipoprotein Receptor Degradation but Interact with Each Other
doi: 10.1074/jbc.M115.647180
Figure Lengend Snippet: Sortilin depletion does not affect LDLR degradation by PCSK9 and has no cholesterol phenotype in mice. A, Huh7 cells were transfected with control non-target, APLP2-, and/or sortilin-specific siRNAs. After 48 h, cells were incubated in serum-free media for 24 h. Cell lysates were then subjected to Western blotting using LDLR, sortilin, APLP2, and β-actin antibodies. B, total liver extracts of Sort+/+ (n = 3), Sort1−/− (n = 3), Ldlr−/− (n = 1), Pcsk9+/+ (n = 1), and Pcsk9−/− (n = 1) mice were analyzed by Western blot analysis. Accurate quantification of LDLR and sortilin signals and their normalization to that of β-actin was obtained by LI-COR analysis of a duplicate gel. Relative LDLR/β-actin signals were normalized to that of control (A and B in bold). C, immunohistochemistry of surface LDLR (green) in the liver of Sort+/+, Sort1−/−, Ldlr−/−, and Pcsk9−/− mice. Surface LDLR levels in the liver of Sort1−/− and Sort+/+ mice were similar. Bar = 60 μm. Plasma (D) total cholesterol and (E) PCSK9 measured by ELISA, in control Pcsk9+/+ and Pcsk9−/− mice, and in Sort+/+ and Sort1−/− mice. Error bars represent S.E. ***, p < 3 × 10⁻⁵ (Student's t test). F, Western blot analysis of total liver extracts of Pcsk9+/+ (n = 3), Pcsk9+/− (n = 3), and Pcsk9−/− (n = 3) mice. Accurate quantification of LDLR and its normalization to that of β-actin was obtained by BioRad Image Lab 5.2 analysis of the same gel. Relative LDLR/β-actin signals were normalized to that of Pcsk9+/+ (in bold). These data are representative of at least two independent experiments.
Article Snippet: Immunohistochemistry of LDLR in the Liver Cryosections were incubated with a
Techniques: Transfection, Incubation, Western Blot, Immunohistochemistry, Enzyme-linked Immunosorbent Assay

Journal: The Journal of Biological Chemistry
Article Title: Amyloid Precursor-like Protein 2 and Sortilin Do Not Regulate the PCSK9 Convertase-mediated Low Density Lipoprotein Receptor Degradation but Interact with Each Other
doi: 10.1074/jbc.M115.647180
Figure Lengend Snippet: APLP2-deficient mice exhibit reduced levels of circulating PCSK9 but similar levels of total and cell surface LDLR in the liver. A, plasma levels of PCSK9 were measured by ELISA in Aplp2+/+ (WT) and Aplp2−/− mice. Error bars represent S.E. **, p < 0.01 (Student's t test). B, liver extracts of Aplp2+/+ (n = 4), Aplp2−/− (n = 3), and Pcsk9−/− (n = 1) mice were analyzed by Western blot analysis. The latter showed a 2.5-fold higher level of LDLR. Note that liver APLP2 levels were not affected in Pcsk9−/− mice (last lane). C, immunohistochemistry of surface LDLR (green) in the liver of Aplp2+/+, Aplp2−/−, Ldlr−/−, and Pcsk9−/− mice. Bar = 60 μm. D, LDLR levels were analyzed in primary hepatocytes isolated from Pcsk9−/− (n = 1), Aplp2+/+ and Aplp2−/− (n = 3) mice. E, Aplp2+/+ and Aplp2−/− primary hepatocytes were incubated without or with purified human PCSK9 (10 μg/ml) for 2 and/or 16 h. LDLR relative intensities to β-actin obtained by Western blotting were normalized to that of the Aplp2+/+ signal in the absence of PCSK9 (first lane in bold). These data are representative of at least two independent experiments.
Article Snippet: Immunohistochemistry of LDLR in the Liver Cryosections were incubated with a
Techniques: Enzyme-linked Immunosorbent Assay, Western Blot, Immunohistochemistry, Isolation, Incubation, Purification
Journal: bioRxiv
Article Title: Activity-dependent regulation of vascular cholesterol metabolism acts as a negative feedback mechanism for neurovascular coupling
doi: 10.1101/2024.02.23.581685
Figure Lengend Snippet: (A) Heat map of cholesterol gene expression in brain endothelial cells after neuronal activating (A) or silencing (S) (Pulido et al., 2020). DREADDs activating mice, DREADDs silencing mice, and respective littermate controls were injected with CNO. Bulk RNA sequencing was performed on isolated endothelial cells. Heat map color scale indicates log 2 fold change from the average gene expression in respective control mice. Each column is one sample. Asterisks indicate FDR adjusted p-value from original sequencing data, with asterisks on the left of the gene name describing the silencing condition vs respective control and asterisks on the right of the gene name describing activating vs respective control (*p-adj<0.05; **p-adj<0.01). (B) Quantification of percentage of CD31+ vascular length that is also LDLR+ in DREADDs activating mice and littermate controls 3 hours after CNO injection. Increasing neuronal activity increases percent vascular length that is LDLR+ (n=8-9; p=0.0033, unpaired two-tailed t-test). Error bars represent SEM. (C) Heat map of cholesterol gene expression in a brain endothelial stem cell model after exposure to low (L) or high (H) shear stress. Human iPSCs were differentiated into endothelial-like cells and treated with CHIR to further induce brain endothelial properties. Cells were exposed to low or high shear stress for 72 hours and RNA was isolated for sequencing. Asterisks indicate adjusted p-value (*p-adj<0.05; **p-adj<0.01; ***p-adj<0.001; ****p-adj<0.0001). Heat map color scale indicates log 2 fold change from the average gene expression in low shear stress condition.
Article Snippet:
Techniques: Gene Expression, Injection, RNA Sequencing, Isolation, Control, Sequencing, Activity Assay, Two Tailed Test, Shear
Journal: bioRxiv
Article Title: Activity-dependent regulation of vascular cholesterol metabolism acts as a negative feedback mechanism for neurovascular coupling
doi: 10.1101/2024.02.23.581685
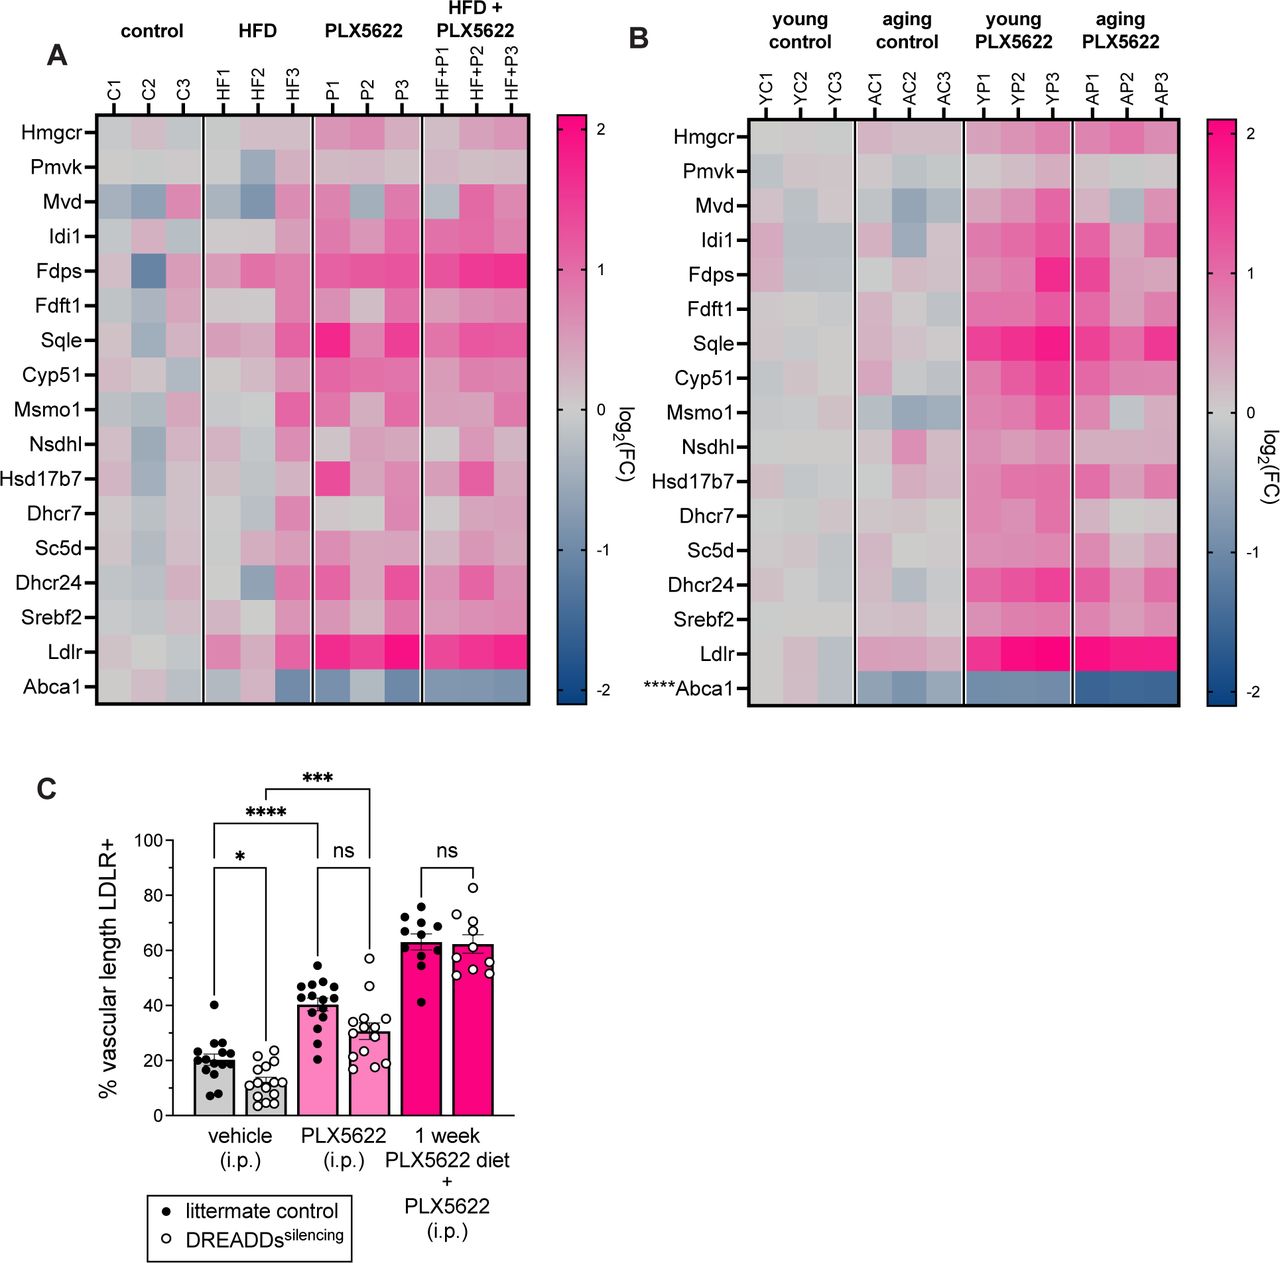
Figure Lengend Snippet: (A) Heat map of cholesterol gene expression in brain endothelial cells after one month of control (C), high-fat (HF), PLX5622 (P), or high-fat+PLX5622 (HF+P) diet. Endothelial cells were isolated by FACS, and bulk RNA sequencing was performed on isolated mRNA. Each column is one sample. No cholesterol-related genes had a p-adj<0.05 in the comparison between control vs high-fat diet groups. Heat map color scale indicates log 2 fold change from the average gene expression in mice on control diet. (B) Heat map of cholesterol gene expression in brain endothelial cells at age 12 weeks (young, Y) or 17.5 months (aging, A). Mice were raised on vivarium chow and switched to control (C) or PLX5622 (P) diet starting at 8 weeks of age to the time of tissue collection. Endothelial cells were isolated by FACS, and bulk RNA sequencing was performed on isolated mRNA. Each column is one sample. Asterisks indicate adjusted p-value (*p-adj<0.05; **p-adj<0.01; ***p-adj<0.001; ****p-adj<0.0001) for young vs aging mice on control diet. Heat map color scale indicates log 2 fold change from the average gene expression in young mice on control diet. (C) Quantification of percentage of CD31+ vascular length that is also LDLR+ in DREADDs silencing and control mice injected with PLX5622 or vehicle at the onset of the dark (waking) cycle (time=0). All mice were injected with CNO at times 0, 4, and 8 hours to maintain neuronal silencing, and tissue was collected at t=12 hours. Silencing reduced percent vascular length that was LDLR+ while PLX5622 increased it (p=0.0229; p=0.0002). There was a trend towards lower percent vascular length LDLR+ in the PLX5622+silencing group compared to the PLX5622 group (p=0.0827). Experiment was repeated in a second cohort of DREADDs silencing and control mice fed PLX5622 diet for one week. After one week of PLX5622 diet, there was no difference between control and silencing groups (p>0.999). n=10-15 per group; Brown-Forsythe and Welch ANOVA. Error bars represent SEM.
Article Snippet:
Techniques: Gene Expression, Control, Isolation, RNA Sequencing, Comparison, Injection

Journal: bioRxiv
Article Title: Activity-dependent regulation of vascular cholesterol metabolism acts as a negative feedback mechanism for neurovascular coupling
doi: 10.1101/2024.02.23.581685
Figure Lengend Snippet: Mice were euthanized with sodium pentobarbital and decapitated. Vascular segments containing both capillaries and arterioles were dissected from cortical tissue surrounding the middle cerebral artery. The arteriole was cannulated on one end and tied off on the other to maintain pressurization. (A) Representative images of pipette placement for K + stimulation of capillaries (left, orange) and arterioles (right, purple) (B) Representative traces of arteriole dilation after K + stimulation of capillaries and arterioles from mice fed control (left) or PLX5622 diet (right) for at least 1 month before ex vivo preparation. PLX5622-mediated deficits in arteriole dilation following capillary stimulation were rescued by cholesterol depletion with 30-minute bath application of 5mM MβCD. Bath application of 0 Ca 2+ demonstrates maximum dilation capacity of arterioles. Scale bars represent 10 microns dilation and 5 minutes time. (C) Quantification of experiment shown in (B). Arteriole dilation in response to K + stimulation is represented as percentage of maximum dilation. PLX5622 induced deficits in dilation response (p-adj<0.0001) were rescued by MβCD (p-adj<0.0001). Rescued response was still significantly lower than control response (p-adj=0.0099). n=5-10, one-way ANOVA with Bonferroni’s multiple comparisons test. Error bars represent SEM. (D) Representative images of cortical sections from mice injected with AAV-BR1-smFP_Myc or AAV-BR1-LDLR. Sections stained with antibodies against CD31 (green) and LDLR (magenta). Scale bar represents 100 μm. (E) Quantification of percentage CD31+ vascular length that is also LDLR+. AAV-BR1-LDLR significantly increases vascular LDLR. n=3; p=0.0033, unpaired t-test. (F) Representative traces of arteriole dilation after K + stimulation of capillaries and arterioles from mice injected with AAV-BR1-smFP_Myc (left) or AAV-BR1-LDLR (right) 2-4 weeks before ex vivo preparation. Brain endothelial cell LDLR overexpression-mediated deficits in arteriole dilation following capillary stimulation were rescued by cholesterol depletion with 30-minute bath application of 5mM MβCD. Bath application of 0 Ca 2+ demonstrates maximum dilation capacity of arterioles. Scale bars represent 10 microns dilation and 5 minutes time. (G) Quantification of experiment shown in (D). Arteriole dilation in response to K + stimulation is represented as percentage of maximum dilation. LDLR overexpression in brain endothelial cells induced deficits in dilation response (p-adj=0.0097) were rescued by MβCD (p-adj=0.0088). Rescued response was not significantly different than control response (p-adj>0.9999). n=5-10, one-way ANOVA with Bonferroni’s multiple comparisons test. Error bars represent SEM.
Article Snippet:
Techniques: Transferring, Control, Ex Vivo, Injection, Staining, Over Expression
Journal: Journal of Lipid Research
Article Title: PCSK9 reduces the protein levels of the LDL receptor in mouse brain during development and after ischemic stroke
doi: 10.1194/jlr.M014118
Figure Lengend Snippet: LDLR regulation by PCSK9 in mouse telencephalon at E12.5. A: PCSK9 and LDLR mRNA distribution pattern in cryosections of sagital mouse embryo at E12.5 by in situ hybridization using PCSK9 and LDLR antisense riboprobes and followed by Nissl staining. FCx, frontal cortex; Int, small intestine. B: Immunofluorescence of LDLR on cryosections of E12.5 WT and Pcsk9−/− mice. Nuclei were stained by Hoescht 33258. Bar = 30 μm. C: Representative immunoblots showing LDLR and β-actin protein levels in the telencephalon at E12.5 (100 μg protein load/lane) and in adult liver (30 μg protein load/lane) of WT and Pcsk9−/− mice. The specificity of the LDLR antibody is emphasized by the absence of signal in the liver of Ldlr−/− mice. Bar diagrams represent the protein levels of LDLR normalized to those of β-actin (n = 10 for WT mice and n = 13 for Pcsk9−/− mice). *P < 0.05 by Student-Newman-Keuls. All error bars represent SEM. D: Nissl staining showing the cell layer organization in the telencephalon of WT and Pcsk9−/− mice. The enlarged squared regions are shown on the right. Bars = 200 μm (left) and 40 μm (right).
Article Snippet: For LDLR visualization, brain cryosections were fixed for 1 h in 4% PFA, incubated with
Techniques: In Situ Hybridization, Staining, Immunofluorescence, Western Blot

Journal: Journal of Lipid Research
Article Title: PCSK9 reduces the protein levels of the LDL receptor in mouse brain during development and after ischemic stroke
doi: 10.1194/jlr.M014118
Figure Lengend Snippet: LDLR regulation by PCSK9 in mouse brain at P7. A: In situ hybridization of sagital mouse brain cryosections at P7 with a PCSK9 and LDLR antisense 35S-labeled cRNA riboprobes. B: Immunofluorescence of LDLR in cerebellum cryosections at P7 from WT and Pcsk9−/− mice. Nuclei were stained by Hoescht 33258. Bar = 20 μm. C: Representative immunoblots showing LDLR and β-actin protein levels (100 μg protein load/lane) in the cerebellum of WT and Pcsk9−/− mice at P7. Bar diagrams represent the LDLR protein levels normalized to those of β-actin (n = 5 for WT and Pcsk9−/− mice). *P < 0.05 by Student-Newman-Keuls. All error bars represent the SEM. D: Nissl staining showing the cell layer organization in the cerebellum of WT and Pcsk9−/− mice at P7. The enlarged squared regions are shown below. Bars = 250 μm (upper) and 150 μm (lower).
Article Snippet: For LDLR visualization, brain cryosections were fixed for 1 h in 4% PFA, incubated with
Techniques: In Situ Hybridization, Labeling, Immunofluorescence, Staining, Western Blot

Journal: Journal of Lipid Research
Article Title: PCSK9 reduces the protein levels of the LDL receptor in mouse brain during development and after ischemic stroke
doi: 10.1194/jlr.M014118
Figure Lengend Snippet: LDLR regulation by PCSK9 at adulthood. A: In situ hybridization of sagital adult mouse brain cryosections with a PCSK9 and LDLR antisense 35S-labeled cRNA riboprobes. B: Representative immunoblots showing LDLR and β-actin protein levels in the RE-OP and olfactory bulb (200 μg protein load/lane) and in adult liver (30 μg of protein load/lane) of WT and Pcsk9−/− mice. The specificity of the LDLR antibody is emphasized by the absence of signal in the liver of Ldlr−/− mice. Bar diagrams represent the protein levels of LDLR normalized to those of β-actin in RE-OP and olfactory bulb (n = 9 for WT and Pcsk9−/− mice). All error bars represent the SEM. C: Nissl staining showing the structure of the RE-OP in WT and Pcsk9−/− mice. The enlarged squared regions are shown on the right. Bars = 400 μm (left) and 100 μm (right). D: Nissl staining revealing the structure of the olfactory bulb in WT and Pcsk9−/− mice. Bar = 1 mm.
Article Snippet: For LDLR visualization, brain cryosections were fixed for 1 h in 4% PFA, incubated with
Techniques: In Situ Hybridization, Labeling, Western Blot, Staining

Journal: Journal of Lipid Research
Article Title: PCSK9 reduces the protein levels of the LDL receptor in mouse brain during development and after ischemic stroke
doi: 10.1194/jlr.M014118
Figure Lengend Snippet: LDLR regulation by PCSK9 following tMCAO. A: Representative immunoblots showing the protein levels of LDLR and β-actin in the hippocampus of WT and Pcsk9−/− mice following tMCAO (1 h) and 24 h of brain reperfusion (200 μg protein load/lane) and in adult liver (30 μg protein load/lane). Ipsilateral and contralateral hippocampi were isolated and analyzed separately. Bar diagrams represent the quantitation of the protein levels of LDLR normalized to those of β-actin (n = 4 for WT and Pcsk9−/− mice). *P < 0.05 by Dunnett test. All error bars represent the SEM. B: Representative immunoblots showing the protein levels of LDLR and β-actin in the contralateral hippocampus of WT mice following or not tMCAO (1 h) and 24 h of brain reperfusion (200 μg protein load/lane). Bar diagrams represent the quantitation of the protein levels of LDLR normalized to those of β-actin (n = 4 for sham and n = 3 for tMCAO).
Article Snippet: For LDLR visualization, brain cryosections were fixed for 1 h in 4% PFA, incubated with
Techniques: Western Blot, Isolation, Quantitation Assay